Savvius Insight Plus Review – mini network appliance for small or branch office network performance monitoring and troubleshooting. Managed Service Providers (MSP) and network administrators managing multiple sites will find the Insight to be very useful – better remote support, troubleshooting and reduced travel.
Full disclosure: I was asked by Savvius to write a review and provided a loaner unit for evaluation. I was not compensated in any way and returned the loaner.
Savvius Insight Plus Review
The Savvius Insight is an Ubuntu (Linux) packet capture box that features an Elastic Stack, Logstash, Kibana (ELK) – search & analytics engine with preconfigured dashboards:
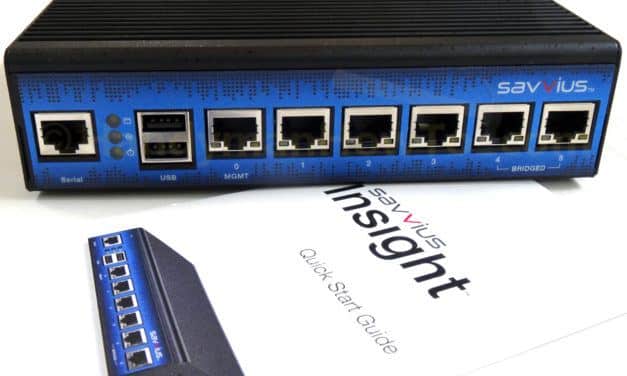
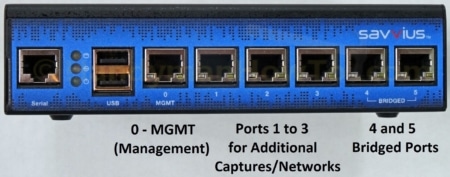
The Insight has no moving parts. The sturdy metal housing is a heatsink so there’s no cooling fan and it has a Solid State Disk (SSD). Status LEDs and network ports are located on the front panel for easy access. Six Gigabit Ethernet ports are available:
- Port 0 MGMT – management port for accessing the Insight via a web browser or SSH, network performance dashboard, retrieving packet captures via Omnipeek or forwarding data to a remote Elastic Search (ELK) or Splunk server.
- Port 1, 2 and 3 – additional GigE ports network captures. Connect these to a mirror port on your network switch. For example, to capture LAN in addition to WAN/Internet traffic.
- Bridge Ports 4 & 5 – Passive capture between any two networks. For remote site monitoring, connect the Internet cable to Port 4 and your LAN-side cable to Port 5. A great feature is the bridge ports “fail to wire” and will pass traffic even if the Insight loses power so it will never be a failure point.
Two Insight models (.pdf) are available and externally identical. Both models are preloaded with Ubuntu server, ELK dashboard and Capture Engine for Omnipeek software.
-
Savvius Insight (standard model)
256 GB SSD Storage, 8 GB RAM, $1,995 -
Savvius Insight Plus
1 TB Storage / 16 GB RAM, $4,395 (with VoIP analysis)
The key difference is the Plus model supports VoIP analysis and more disk capacity. Network users may not notice transient data connection problems but they will complain if there are voice quality or connection issues.
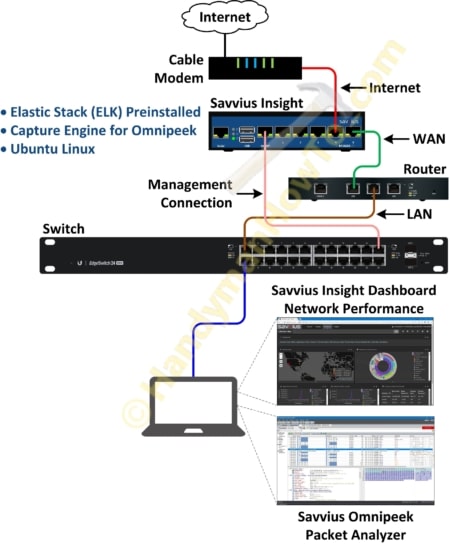
The Savvius Insight installs between the Internet connection and LAN network by connecting to bridge ports 4 and 5. In my case between the cable modem and router as illustrated in the following diagram. Management (MGMT) port 0 is connected to the switch or you can connect a laptop directly to the Insight:
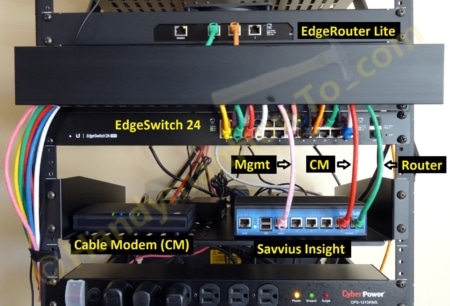
And the Insight installed in my network wall rack:
The Insight configuration is very simple per the Quick Start Guide (.pdf) and I was literally up & running in 5 minutes.
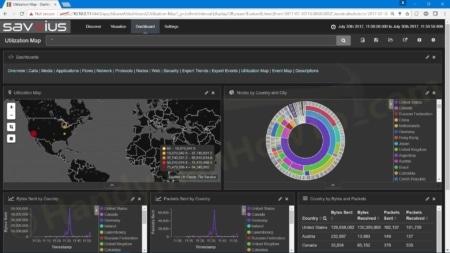
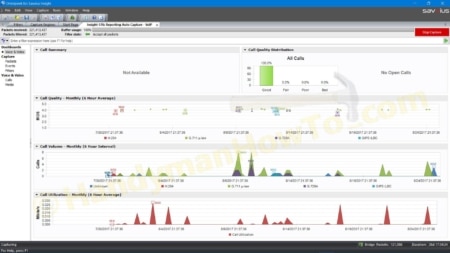
Savvius Insight Network Performance Dashboard
The Insight dashboard is built on Kibana and displays a wealth of information, including a Calls, Media, Applications, Flows, Network, Protocols, etc. that you won’t find in router and server logs.
The Utilization Map concerned me due to the numerous foreign countries hitting my network. Everything on the Internet is constantly probed for vulnerabilities so this isn’t surprising, but I usually don’t see this because my firewall silently drops unsolicited Internet traffic:
I clicked on the Nodes by Country & City pie chart to inspect Argentina because it looks suspicious:
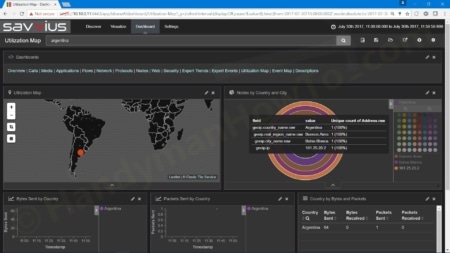
Then I clicked “Discover” on the main menu and searched for the suspect IP address 181.25.20.2 in the logs. The log reveals the Argentina IP is trying to telnet into my router:

I probed the Argentina IP address and found it’s a hacked router in a botnet network.
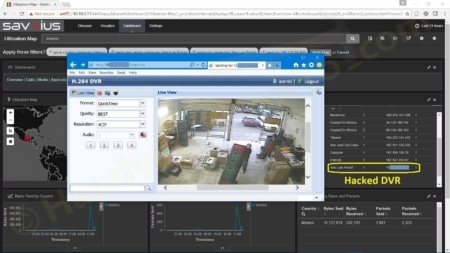
Exploring a different intrusion attempt from Mexico, I found a Digital Video Recorder (DVR) at a warehouse with three cameras. It’s an older system with factory default login credentials that’s been enslaved in a botnet. Maybe it was part of the Mirai botnet?
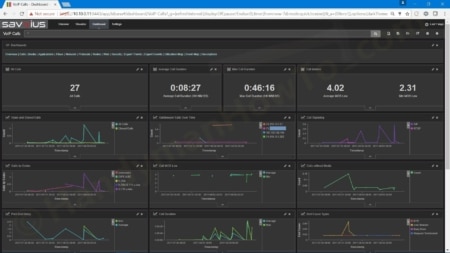
Savvius Insight VoIP Performance Dashboard
The Insight VoIP Calls dashboard displays a tremendous amount of data with just about every performance metric imaginable, including call volume, signaling, media, quality and call dispositions. By segmenting the WAN and LAN sides of the call it’s easy to determine if the problem originated on the local or far end of the network.
Scrolling down displays the Call List which itemizes individual calls with dozens of SIP signal and media performance metrics:
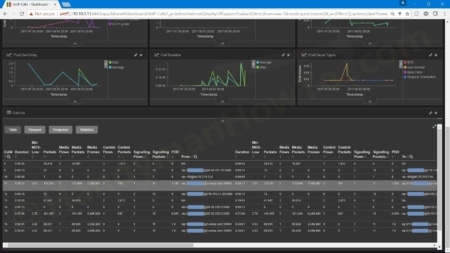
Filtering based on From (originating number) and/or To (dialed number) is simple. This is important when troubleshooting phone users or problem destinations:
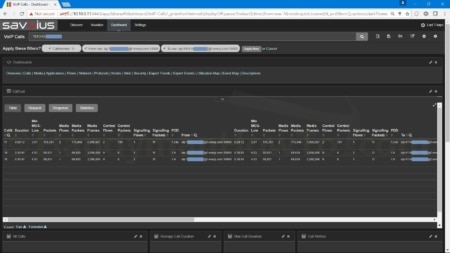
The Insight Plus can store a large history of call records given the 1TB disk capacity.
Omnipeek for Savvius Insight
Omnipeek Insight is a network performance and troubleshooting packet analyzer application for Windows. Omnipeek is optimized for task-oriented investigations and troubleshooting with it’s many dashboards, advanced packet filtering and manipulation features. A license is included with the Savvius Insight. The workflow relationship between the Insight ELK dashboard and Omnipeek is illustrated in the following diagram:
- Insight ELK dashboard for performance, trends and inspection.
- Omnipeek for expert analysis and troubleshooting of packets, flows, calls, etc. on the wire.
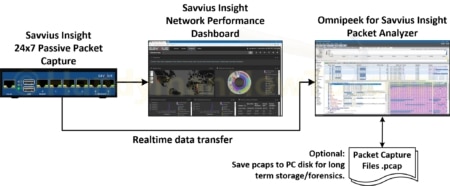
Omnipeek connects to the Savvius Insight and pulls packet captures in realtime. Packet capture (.pcap) files can be saved to the PC hard disk for long term storage and forensics. Pcap files are standard format and compatible with WireShark.
See this 5 minute tutorial and Get Started with Omnipeek:
Omnipeek VoIP Dashboard
The Omnipeek VoIP dashboard is similar to the Insight VoIP Call dashboard and used when you need to zero-in on events for troubleshooting:
The following Expert Events for a SIP INVITE displays the packet sequence, protocol decode and raw bytes:
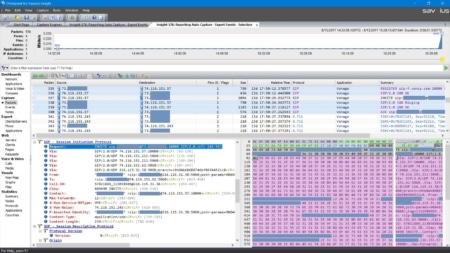
Omnipeek can also display SIP signaling ladder diagrams.
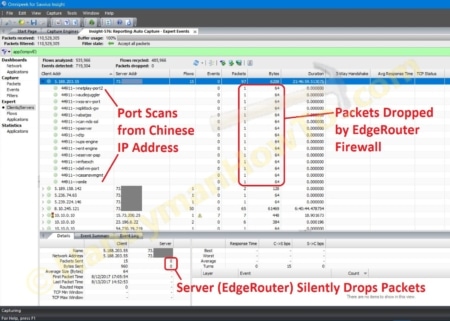
Omnipeek Expert Events – Clients/Servers
The Clients/Servers view shows traffic patterns between two clients or clients and servers. Given my preoccupation with network security and intrusion attempts, unusual traffic patterns tend to catch my eye. In this screen grab, a Chinese source is probing for open TCP ports to exploit. Fortunately, the server – my EdgeRouter firewall – drops the packets per the zero (0) server Packets Sent:
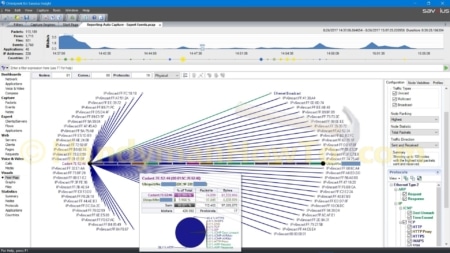
Omnipeek IPv6 Peer Map
Savvius Insight and Omnipeek support IPv4 and IPv6. I haven’t enabled IPv6 on my EdgeRouter but it supported by my ISP. I found it interesting the EdgeRouter created a v6 link-local address (fe80::/64) and responds to v6 Neighbor Discovery Protocol messages. The Omnipeek Peer Map displays the v6 nodes on the Comcast cable modem termination system (CMTS):
Savvius Insight Snort Integration
The Snort Network Intrusion & Detection System can be installed on Savvius Insight. A key issue with Snort is it requires a network tap, which is conveniently provided by the Insight bridge ports. See the Insnort Wiki for instructions and preconfigured dashboards:
Review Summary
Savvius Insight is the only mini network appliance to include an Ubuntu server, pre-installed ELK stack/dashboards and real-time packet capture engine for Omnipeek for troubleshooting. The Plus model features VoIP analysis to monitor call performance and quality. Insight can be deployed in standalone mode or as a forwarder to a remote Elastic Search or Splunk server for centralized monitoring and SIEM integration.
Best,
Bob Jackson